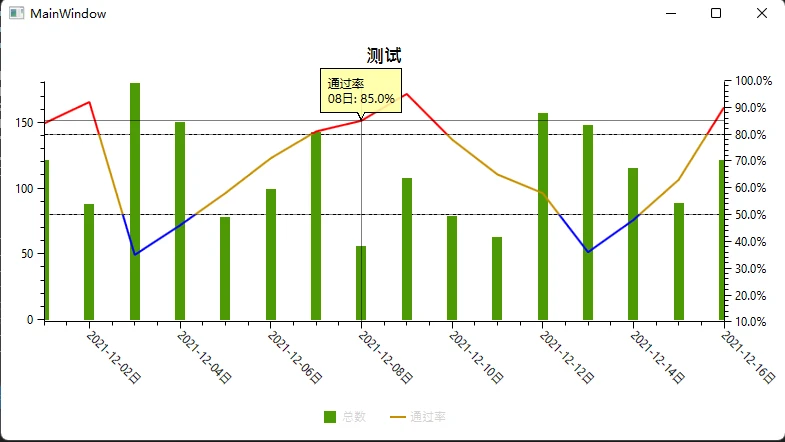
OxyPlot是.NET下一款非常强大的图表库,几乎可以涵盖各种图表的制作,且支持.net下各种平台和运行库,本文通过示例介绍该如何在Wpf中使用OxyPlot。
本文使用的开发工具是Vs2019,sdk使用的是.net5
首先,使用Vs2019创建一个wpf项目,通过包管理器添加OxyPlot.Wpf依赖或者通过命令行添加依赖:
dotnet add package OxyPlot.Wpf然后添加Prism.Core依赖,添加此依赖主要是为了mvvm的支持
dotnet add package Prism.Core在项目中添加MainWindowViewModel.cs类,使其继承自BindableBase类,BindableBase是mvvm模式的viewmodel基类,它实现了INotifyPropertyChanged接口,可以通过数据绑定让UI响应viewmodel的变化
在MainWindowViewModel添加如下代码:
using OxyPlot;
using OxyPlot.Axes;
using OxyPlot.Legends;
using OxyPlot.Series;
using Prism.Mvvm;
using System;
using System.Collections.Generic;
using System.Threading.Tasks;

namespace WpfChart.Test
{
    public class MainWindowViewModel : BindableBase
    {
        public MainWindowViewModel()
        {
            // 构造函数中同步生成数据,无需设置mvvm属性
            // _ChartModel = CreateChartModel(data);

            // 异步获取图表数据
            GetData().ContinueWith(x => {
                // 设置mvvm属性更新图表Model
                ChartModel = CreateChartModel(x.Result);
                // 不使用mvvm属性,使用下面方法通知UI
                // RaisePropertyChanged(nameof(ChartModel));
            });
        }


        private PlotModel _ChartModel;
        /// <summary>
        /// 图表Model的mvvm属性,可通知UI更新
        /// </summary>
        public PlotModel ChartModel
        {
            get { return _ChartModel; }
            set { SetProperty(ref _ChartModel, value); }
        }

        ...
        ...
    }
在MainWindow.xaml中添加如下内容:
<Window ...
        xmlns:oxyWpf="http://oxyplot.org/wpf"
        ...
        >

    <Grid>
        <oxyWpf:PlotView Foreground="Black" Margin="5 5 5 0" Background="Transparent" Model="{Binding ChartModel}" />
    </Grid>
</Window>
在MainWindow.xaml.cs中为数据绑定添加数据上下文
    public partial class MainWindow : Window
    {
        public MainWindow()
        {
            InitializeComponent();
            // 添加数据绑定上下文
            DataContext = new MainWindowViewModel();
        }
    }
这里我们通过数据绑定的方法显示图表,需要添加实体对象类:
    public class ChartData
    {
        public DateTime Date { get; set; }

        public double Total { get; set; }

        public double PassRate { get; set; }
    }
添加测试数据,模拟后台查询方法:
        /// <summary>
        /// 模拟后台异步查询表格数据
        /// </summary>
        /// <returns></returns>
        private Task<List<ChartData>> GetData()
        {
            var data = new List<ChartData>()
            {
                new ChartData { Date = DateTime.Now.Date.AddDays(-15), Total = 121, PassRate = .84 },
                new ChartData { Date = DateTime.Now.Date.AddDays(-14), Total = 88, PassRate = .92 },
                new ChartData { Date = DateTime.Now.Date.AddDays(-13), Total = 180, PassRate = .35 },
                new ChartData { Date = DateTime.Now.Date.AddDays(-12), Total = 150, PassRate = .46 },
                new ChartData { Date = DateTime.Now.Date.AddDays(-11), Total = 78, PassRate = .58 },
                new ChartData { Date = DateTime.Now.Date.AddDays(-10), Total = 99, PassRate = .71 },
                new ChartData { Date = DateTime.Now.Date.AddDays(-9), Total = 143, PassRate = .81 },
                new ChartData { Date = DateTime.Now.Date.AddDays(-8), Total = 56, PassRate = .85 },
                new ChartData { Date = DateTime.Now.Date.AddDays(-7), Total = 108, PassRate = .95 },
                new ChartData { Date = DateTime.Now.Date.AddDays(-6), Total = 79, PassRate = .78 },
                new ChartData { Date = DateTime.Now.Date.AddDays(-5), Total = 63, PassRate = .65 },
                new ChartData { Date = DateTime.Now.Date.AddDays(-4), Total = 157, PassRate = .58 },
                new ChartData { Date = DateTime.Now.Date.AddDays(-3), Total = 148, PassRate = .36 },
                new ChartData { Date = DateTime.Now.Date.AddDays(-2), Total = 115, PassRate = .48 },
                new ChartData { Date = DateTime.Now.Date.AddDays(-1), Total = 89, PassRate = .63 },
                new ChartData { Date = DateTime.Now.Date, Total = 121, PassRate = .90 },
            };
            return Task.FromResult(data);
        }
添加生成图表模型的方法,方法中创建一个图表模型,在其中添加一个日期x轴,一个数字y轴,一个百分比y轴,还添加了柱状图和折线图两个不同的图表系列,并将测试数据绑定到这两个图表系列中,代码如下:
        /// <summary>
        /// 根据数据生成图表模型
        /// </summary>
        /// <param name="list"></param>
        /// <returns></returns>
        private PlotModel CreateChartModel(List<ChartData> list)
        {
            var model = new PlotModel() { Title = "测试"};

            // 添加图例说明
            model.Legends.Add(new Legend
            {
                LegendPlacement = LegendPlacement.Outside,
                LegendPosition = LegendPosition.BottomCenter,
                LegendOrientation = LegendOrientation.Horizontal,
                LegendBorderThickness = 0,
                LegendTextColor = OxyColors.LightGray
            });

            // 定义第一个Y轴y1,显示数量
            var ay1 = new LinearAxis()
            {
                Key = "y1",
                Position = AxisPosition.Left,
            };


            // 定义第二个Y轴y2,显示百分比
            var ay2 = new LinearAxis()
            {
                Key = "y2",
                Position = AxisPosition.Right,
                Minimum = 0.1,
                MajorStep = .1,
                Maximum = 1,
                LabelFormatter = v => $"{v:P1}"
            };
            // 在第二Y轴坐标50%和80%处显示网格线
            ay2.ExtraGridlines = new double[2] { 0.5, 0.8 };
            ay2.ExtraGridlineStyle = LineStyle.DashDashDot; // 网格线样式

            // 定义X轴为日期轴,从15天前到现在
            var minValue = DateTimeAxis.ToDouble(DateTime.Now.Date.AddDays(-15));
            var maxValue = DateTimeAxis.ToDouble(DateTime.Now.Date);
            var ax = new DateTimeAxis()
            {
                Minimum = minValue,
                Maximum = maxValue,
                StringFormat = "yyyy-MM-dd日",
                MajorStep = 2,
                Position = AxisPosition.Bottom,
                Angle = 45,
                IsZoomEnabled = false
            };

            // 定义柱形图序列,指定数据轴为Y1轴
            var totalBarSeries = new LinearBarSeries();
            totalBarSeries.YAxisKey = "y1";
            totalBarSeries.BarWidth = 10;
            //totalBarSeries.FillColor = OxyColor.FromArgb(69, 76, 175, 80);
            //totalBarSeries.StrokeThickness = 1;
            //totalBarSeries.StrokeColor = OxyColor.FromArgb(255, 76, 175, 80);
            totalBarSeries.Title = "总数";
            // 点击时弹出的label内容
            totalBarSeries.TrackerFormatString = "{0}\r\n{2:dd}日: {4:0}";
            // 设置数据绑定源和字段
            totalBarSeries.ItemsSource = list;
            totalBarSeries.DataFieldX = "Date";
            totalBarSeries.DataFieldY = "Total";
            // 下面为手动添加数据方式
            //totalBarSeries.Points.Add(new DataPoint(DateTimeAxis.ToDouble(DateTime.Now.Date.AddDays(-15)), 333));

            // 定义三色折线图序列,指定数据轴为Y2轴
            var passedRateSeries = new ThreeColorLineSeries();
            passedRateSeries.Title = "通过率";
            passedRateSeries.YAxisKey = "y2";
            // 点击时弹出的label内容
            passedRateSeries.TrackerFormatString = "{0}\r\n{2:dd}日: {4:P1}";
            // 设置颜色阈值范围
            passedRateSeries.LimitHi = .8;
            passedRateSeries.LimitLo = .5;
            // 设置数据绑定源和字段
            passedRateSeries.ItemsSource = list;
            passedRateSeries.DataFieldX = "Date";
            passedRateSeries.DataFieldY = "PassRate";
            // 下面为手动添加数据方式
            //passedRateSeries.Points.Add(new DataPoint(DateTimeAxis.ToDouble(DateTime.Now.Date.AddDays(-15)), .750));
            // 添加图标资源
            model.Series.Add(totalBarSeries);
            model.Series.Add(passedRateSeries);
            model.Axes.Add(ay1);
            model.Axes.Add(ay2);
            model.Axes.Add(ax);
            // 设置图形边框
            model.PlotAreaBorderThickness = new OxyThickness(1, 0, 1, 1);
            return model;
        }
编译运行后效果如下:

官方源码地址,里面包含上百个示例图表 GitHub - oxyplot/oxyplot: A cross-platform plotting library for .NET
本文源码下载
