Vue 高德地图 js API Loca 如何使用 连接线图层、脉冲连线图层
阅读此文你需要已经了解并掌握的:
- 已经会使用常规地图的生成方式
- 已经了解如何载入
Loca插件
如果不了解,可以查看我之前的文章:
高德地图 Vue 中 加载 数据可视化 Loca 的方式
如何使用高德地图 API 做一个路线规划应用,展示自定义路线
高德地图 API Loca 3D动画的说明
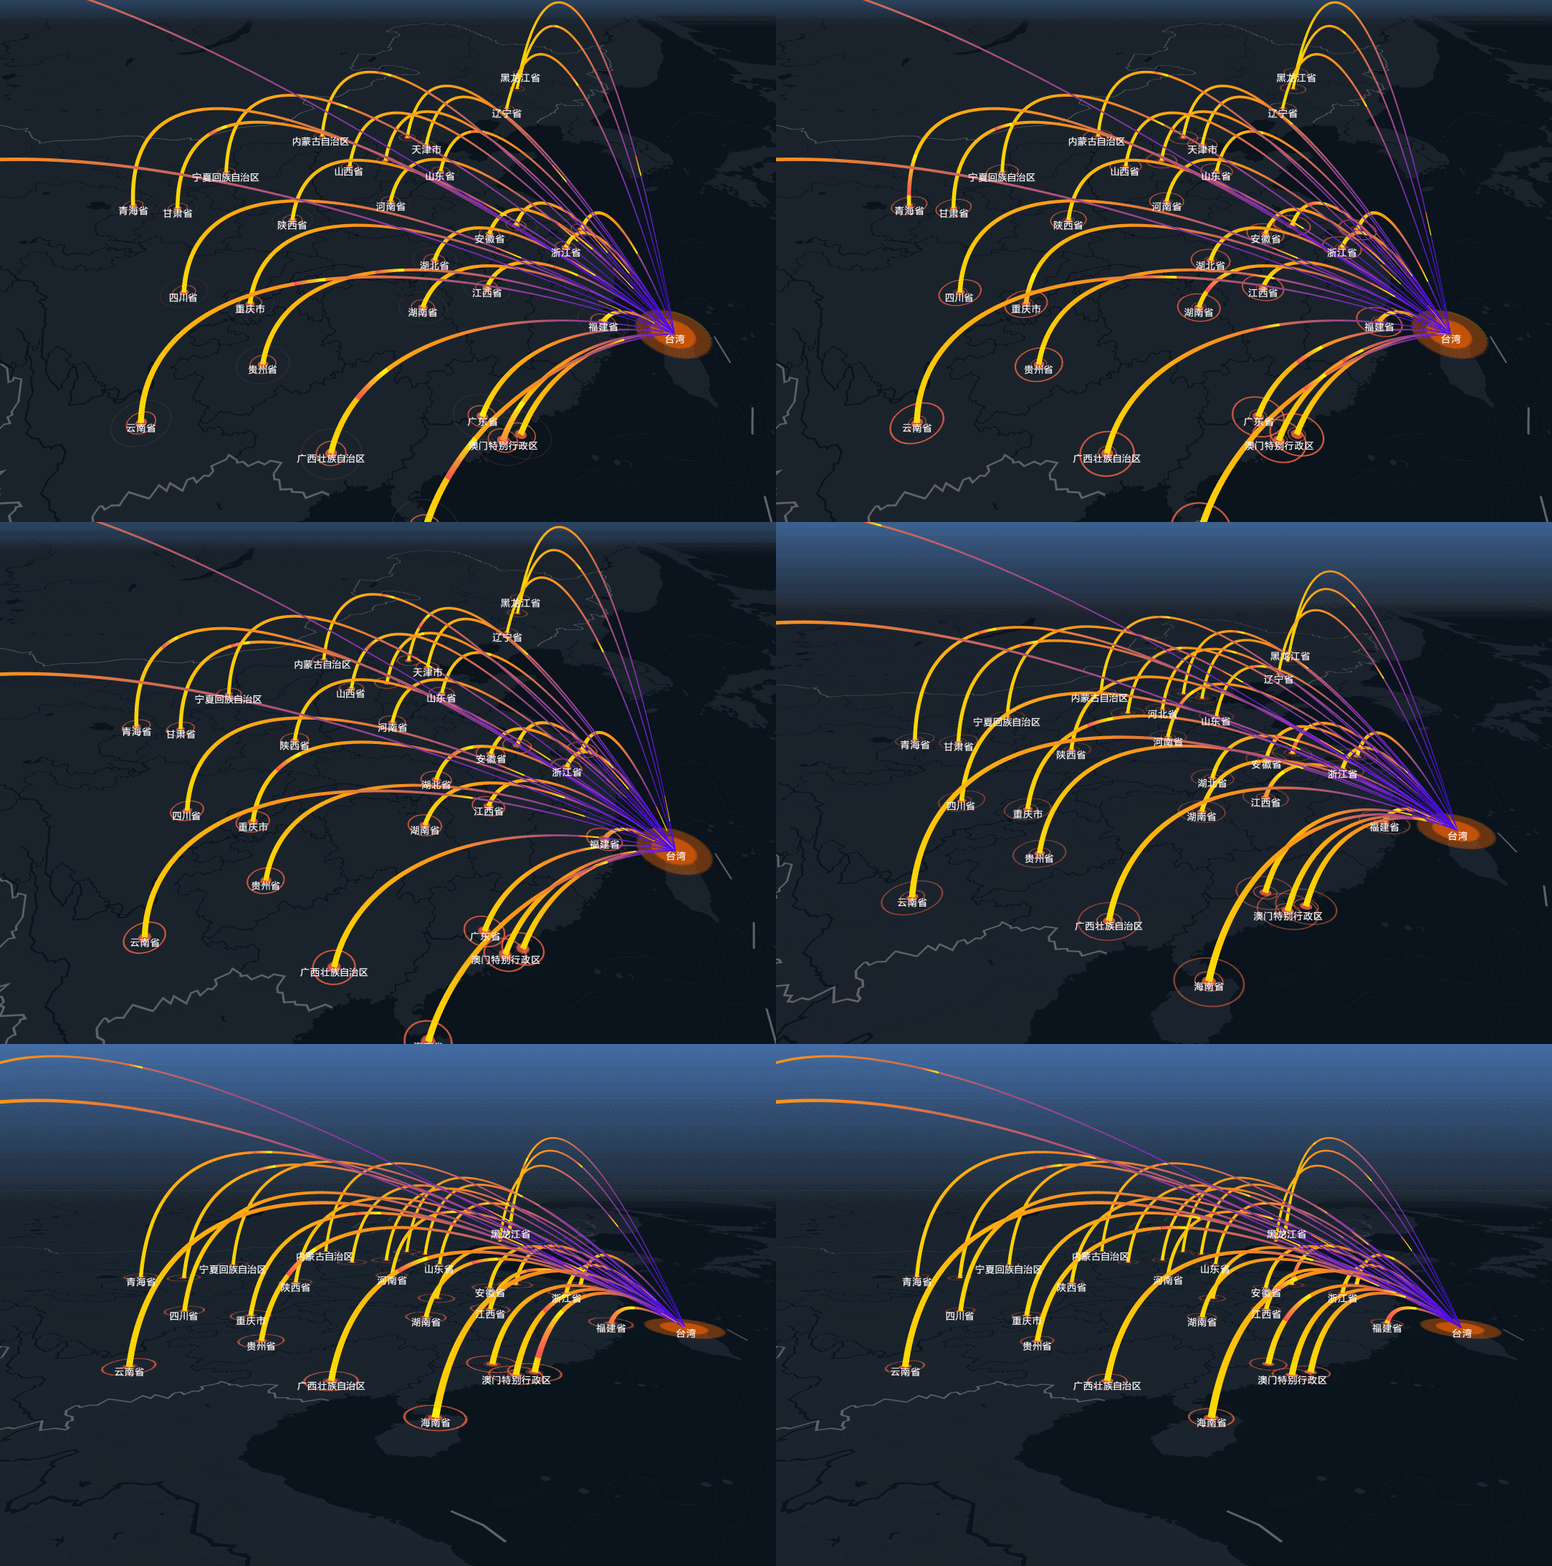
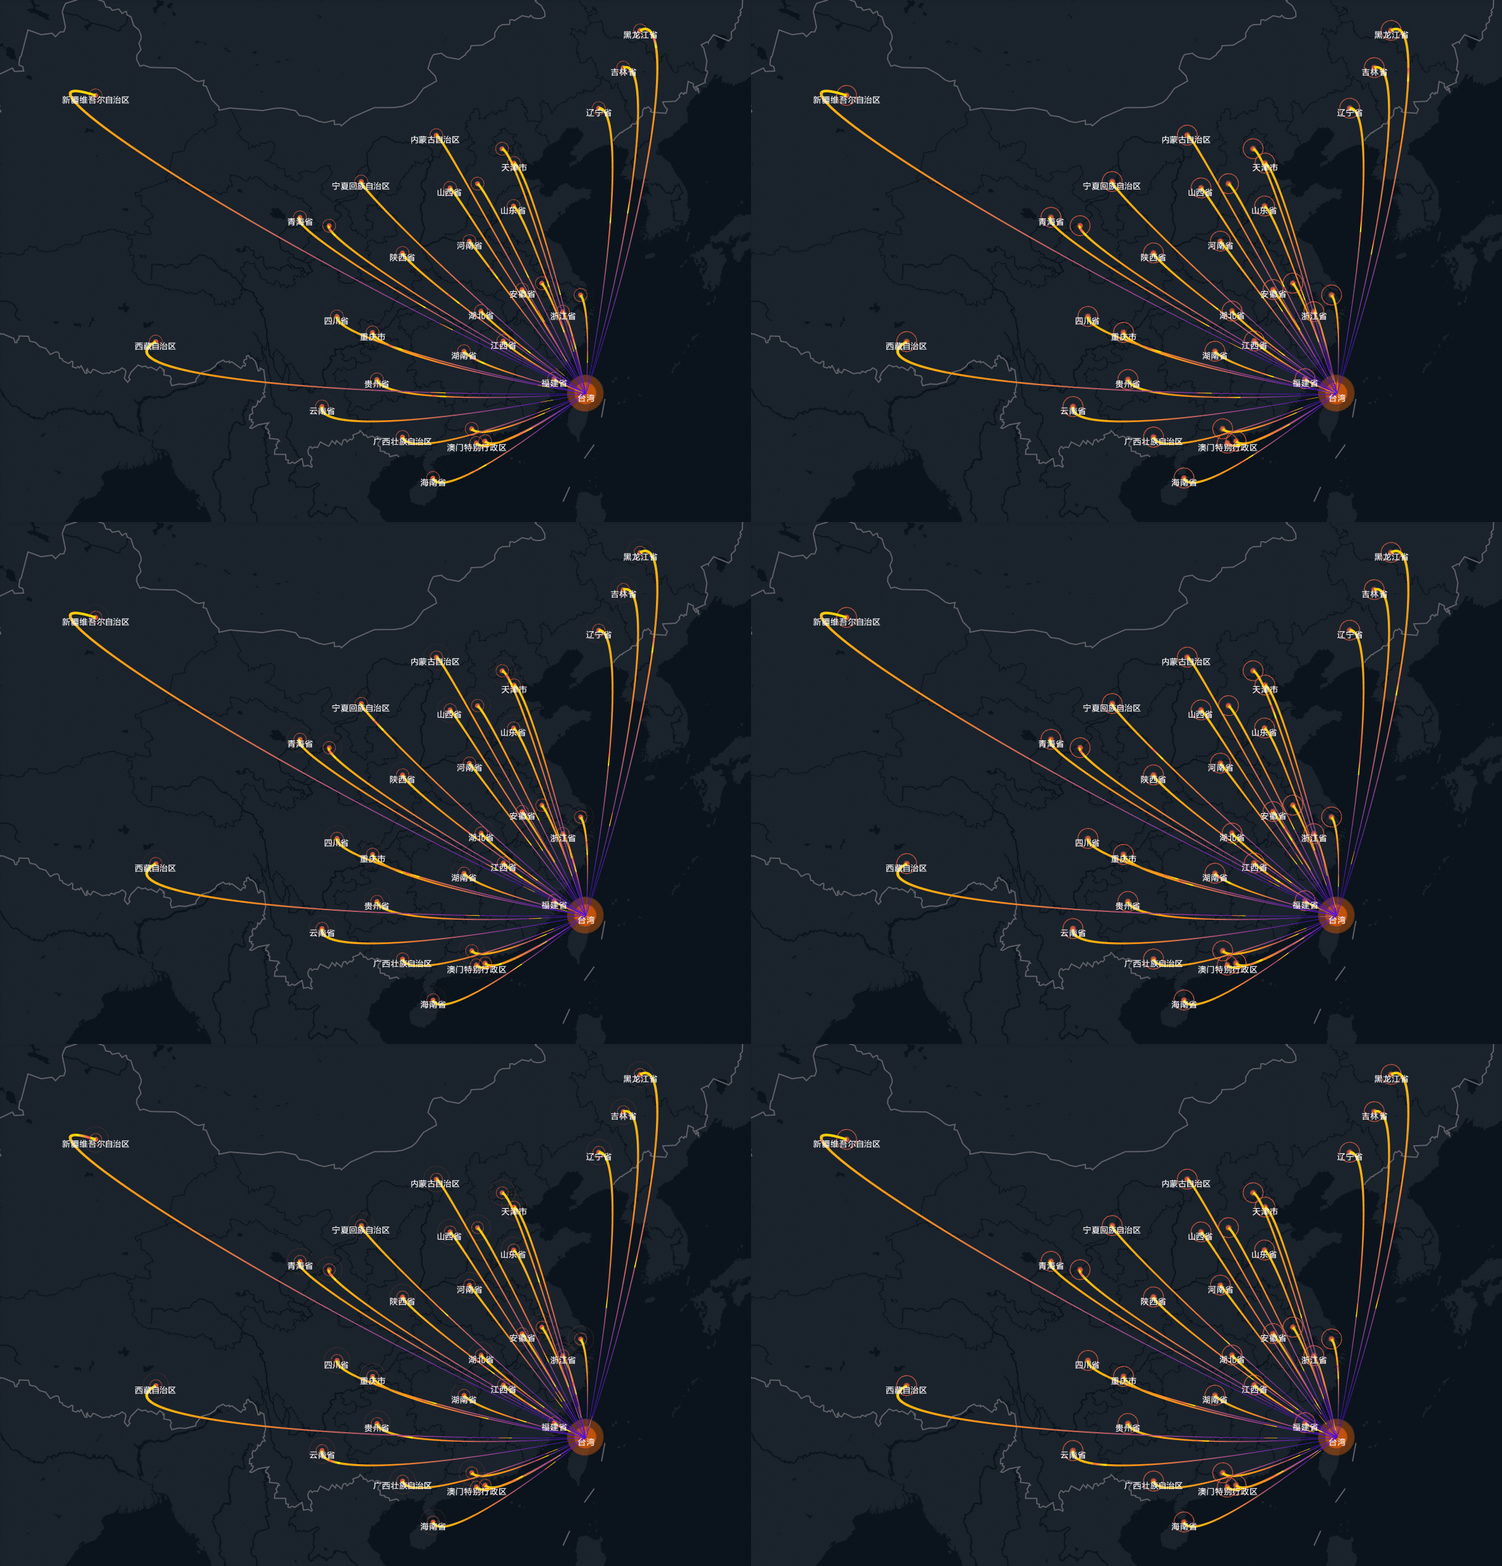
最终实现的效果:
“感谢大哥送来的火箭”
线上实例:(这两个是一样的)
https://kylebing.cn/tools/map/#/other/map-loca
https://kylebing.cn/e/#/api/map-loca


一、基础知识
官方的连接线例子是一个与我国建交的国家连线图
其中用到的两个数据源是:
建交的连接线数据: https://a.amap.com/Loca/static/static/diplomacy-line.json
建交的点数据:https://a.amap.com/Loca/static/static/diplomacy-point.json
1. 这个视图中包含四个图层:
- 一个盛放各省名称的文字图层
AMap.LabelsLayer - 一个盛放各省坐标点位置动画的图层
Loca.ScatterLayer - 一个盛放目标点坐标点位置的图层
Loca.ScatterLayer - 一个显示脉冲连接线的图层
Loca.PulseLinkLayer
2. 做一个这样的视图需要哪几个步骤:
- 新建一个
map,并载入Loca插件。 - 遍历所有省份数据,生成省份名称图层
AMap.LabelsLayer - 遍历所有省份数据,生成省份地理坐标标识图层
Loca.ScatterLayer - 生成目标点的标识图层
Loca.ScatterLayer - 遍历所有省份数据,每个数据包【含目标点】、【当前省份坐标点】两个坐标点的数据,根据两个地点数据生成一条脉冲连接线。然后生成所有省份的连接线
- 最终使 Loca 的动画动起来即可
3. 建立脉冲线需要了解的知识
脉冲线的建立过程是这样的:
// 建立图层
let pulseLayer = new Loca.PulseLinkLayer(图层参数)
// 设置数据源
pulseLayer.setSource(数据参数)
// 设置样式
pulseLayer.setStyle(样式参数)
4. 用到的数据如何生成
Loca 图层接收的数据是 Loca.GeoJSONSource 格式的,而这个对象接收的内容格式是这样的
let locaLayerData = new Loca.GeoJSONSource({
    data: {
        'type': 'FeatureCollection', // 固定
        'features': [ // 这里就是点的数组
            {
                'type': 'Feature',

                // 本例中我们用到的 geometry 有两个格式,一种是 `Point` 一种是 `LineString`,
                'geometry': {
                    'type': 'Point',
                    'coordinates': [121.504673, 25.046711], // 地理经纬度
                },
            },
        ],
    },
})
这是 LineString 格式时的 geometry 结构,
'geometry': {
    'type': 'LineString ',
    'coordinates': [ // 地理经纬度,这里有两个经纬度值
    	[121.504673, 25.046711], // 连接线的起点
    	[121.504673, 25.046711]  // 连接线的终点
    ],
},
了解了以上的结构,就可以根据自己需要来进行修改,生成数据了。
比如,我们得到官方的省份数据如下:
[
  { "name": "北京市", "center": "116.407394,39.904211" },
  { "name": "天津市", "center": "117.200983,39.084158" },
]
我们就可以根据这个生成点【坐标层图层数据】:
computed: {
    // 根据省份地址,生成展示地图需要的格式化数据
    dataPoints(){
        let tempData = GEO_PROVINCE_DATA.map(item => {
            let co = item.center.split(',').map(item => Number(item)) // 将字符串拆分成坐标数组数据
            return {
                "type": "Feature",
                "properties": {"province": item.name},
                "geometry": {
                    "type": "Point", // 点位
                    "coordinates": co
                }
            }
        })
        return {
            "type": "FeatureCollection",
            "features": tempData
        }
    },

    // 连接线图层数据
    dataLines(){
        let tempData = GEO_PROVINCE_DATA.map(item => {
            let co = item.center.split(',').map(item => Number(item)) // 将字符串拆分成坐标数组数据
            return {
                "type": "Feature",
                "properties": {"province": item.name},
                "geometry": {
                    "type": "LineString", // 线段
                    "coordinates": [
                        TARGET_POINT, // target location
                        co
                    ]
                }
            }
        })
        return {
            "type": "FeatureCollection",
            "features": tempData
        }
    },
}
使用的时候生成 geo 数据
const geoDataPoints = new Loca.GeoJSONSource({
    data: this.dataPoints,
})
const geoDataLines = new Loca.GeoJSONSource({
    data: this.dataLines,
})
根据这些数据载入图层:
// 图层点坐标
let loadLocation = () => {
    setLabelsLayer(this.dataPoints)
    scatterLayer2.setSource(geoDataPoints)
    scatterLayer2.setStyle({
        size: [250000, 250000], // 点的大小
        unit: 'miter',
        animate: true,
        duration: 1000,
        texture: 'https://a.amap.com/Loca/static/static/orange.png',
        // texture: 'https://a.amap.com/Loca/static/static/green.png',
    })
    this.loca.add(scatterLayer2)

    // this.loca.animate.start() // 开始动画
}
loadLocation()
// 连接线图层
let linkLayer = new Loca.LinkLayer({
    zIndex: 20,
    opacity: 1,
    visible: true,
    zooms: [2, 22],
})
let loadLine = () => {
    linkLayer.setSource(geoDataLines)
    linkLayer.setStyle({
        lineColors: ['#ff7514', '#ff0008'],
        height: (index, item) => {
            return item.distance / 2
        },
        smoothSteps: 300
    })
    this.loca.add(linkLayer)
}
loadLine()
// pulse layer
let pulseLayer = new Loca.PulseLinkLayer({
    zIndex: 20,
    opacity: 1,
    visible: true,
    zooms: [2, 22],
})
let loadPulse = () => {
    pulseLayer.setSource(geoDataLinesReverse)
    pulseLayer.setStyle({
        height: (index, item) => {
            return item.distance / 2
        },
        unit: 'meter',
        dash: [40000, 0, 40000, 0],
        lineWidth: function () {
            return [20000, 2000]; // 始末 节点的线段宽度
        },
        // altitude: 1000,
        smoothSteps: 100, // 曲线圆滑度
        speed: function (index, prop) {
            return 1000 + Math.random() * 200000;
        },
        flowLength: 100000,
        lineColors: function (index, feat) {
            return ['rgb(255,221,0)', 'rgb(255,141,27)', 'rgb(65,0,255)'];
        },
        maxHeightScale: 0.3, // 弧顶位置比例
        headColor: 'rgba(255, 255, 0, 1)', // 线段中流动的
        trailColor: 'rgb(255,84,84)',
    })
    this.loca.add(pulseLayer)
}
loadPulse()
这些结束后,让动画动起来
this.map.on('complete', ()=> {
    this.loca.animate.start()
})
此时俯视图是这个样子:

再加一些 Loca 动画,就成了这个样子

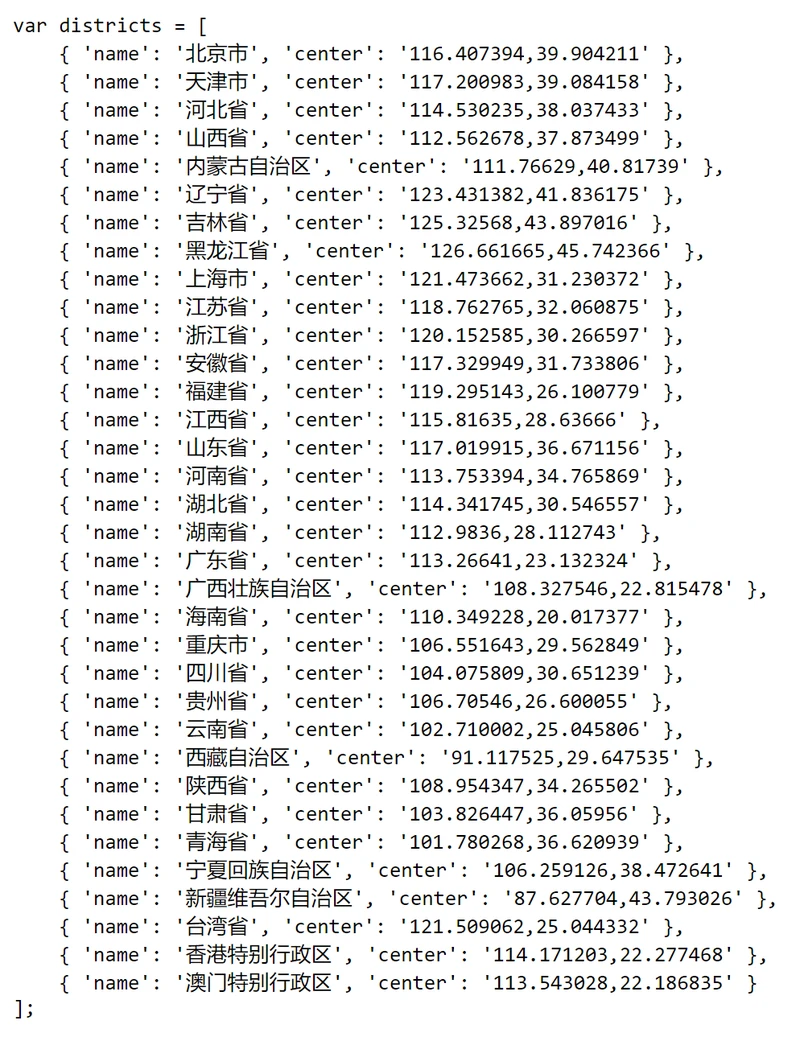
备注:用到的官方数据、资源
各省会数据: https://a.amap.com/Loca/static/mock/districts.js

中心点图标: https://a.amap.com/Loca/static/static/center-point.png
动画点(绿色):https://a.amap.com/Loca/static/static/green.png

动画点(橙色):https://a.amap.com/Loca/static/static/green.png

完整代码:自行将 appID 替换成自己的
province.json
[
  { "name": "北京市", "center": "116.407394,39.904211" },
  { "name": "天津市", "center": "117.200983,39.084158" },
  { "name": "河北省", "center": "114.530235,38.037433" },
  { "name": "山西省", "center": "112.562678,37.873499" },
  { "name": "内蒙古自治区", "center": "111.76629,40.81739" },
  { "name": "辽宁省", "center": "123.431382,41.836175" },
  { "name": "吉林省", "center": "125.32568,43.897016" },
  { "name": "黑龙江省", "center": "126.661665,45.742366" },
  { "name": "上海市", "center": "121.473662,31.230372" },
  { "name": "江苏省", "center": "118.762765,32.060875" },
  { "name": "浙江省", "center": "120.152585,30.266597" },
  { "name": "安徽省", "center": "117.329949,31.733806" },
  { "name": "福建省", "center": "119.295143,26.100779" },
  { "name": "江西省", "center": "115.81635,28.63666" },
  { "name": "山东省", "center": "117.019915,36.671156" },
  { "name": "河南省", "center": "113.753394,34.765869" },
  { "name": "湖北省", "center": "114.341745,30.546557" },
  { "name": "湖南省", "center": "112.9836,28.112743" },
  { "name": "广东省", "center": "113.26641,23.132324" },
  { "name": "广西壮族自治区", "center": "108.327546,22.815478" },
  { "name": "海南省", "center": "110.349228,20.017377" },
  { "name": "重庆市", "center": "106.551643,29.562849" },
  { "name": "四川省", "center": "104.075809,30.651239" },
  { "name": "贵州省", "center": "106.70546,26.600055" },
  { "name": "云南省", "center": "102.710002,25.045806" },
  { "name": "西藏自治区", "center": "91.117525,29.647535" },
  { "name": "陕西省", "center": "108.954347,34.265502" },
  { "name": "甘肃省", "center": "103.826447,36.05956" },
  { "name": "青海省", "center": "101.780268,36.620939" },
  { "name": "宁夏回族自治区", "center": "106.259126,38.472641" },
  { "name": "新疆维吾尔自治区", "center": "87.627704,43.793026" },
  { "name": "香港特别行政区", "center": "114.171203,22.277468" },
  { "name": "澳门特别行政区", "center": "113.543028,22.186835" }
]
MapLoca.vue
<template>
<div class="map-container">
<div id="container" :style="`height: ${insets.height}px`"></div>
</div>
</template>
<script>
import AMapLoader from '@amap/amap-jsapi-loader'
import {mapState} from "vuex"
import GEO_PROVINCE_DATA from './province.json'
import LaunchButton from "@/components/LaunnchButton";
let AMap = null
const TARGET_POINT = [121.504673, 25.046711] // 目标坐标 台湾
const DESTINATION_POINT = [110.504673, 28.046711] // 目标坐标
export default {
name: "MapLoca",
components: {LaunchButton},
data() {
return {
isLoading: false,
contentHeight: 400,
map: null,
loca: null,
}
},
mounted() {
this.contentHeight = window.innerHeight
AMapLoader.load({
key: "替换成自己申请的高德web app id", // 开发应用的 ID
version: "2.0", // 指定要加载的 JSAPI 的版本,缺省时默认为 1.4.15
plugins: [],
Loca:{
version: '2.0.0',
},
AMapUI: { // 是否加载 AMapUI,缺省不加载
version: '1.1', // AMapUI 缺省 1.1
plugins: [], // 需要加载的 AMapUI ui插件
},
}).then(map => {
AMap = map
this.map = new AMap.Map('container', {
viewMode: '3D',
zoom: 6,
pitch: 32,
center: TARGET_POINT,
mapStyle: 'amap://styles/grey',
showBuildingBlock: true, // 显示建筑物
showLabel: false, // 不显示地名什么的
})
// 文字图层
let labelLayer = new AMap.LabelsLayer({
rejectMapMask: true,
collision: true,
animation: true,
})
this.map.add(labelLayer)
this.loca = new Loca.Container({
map: this.map,
})
let scatterLayer2 = new Loca.ScatterLayer({
zIndex: 10,
opacity: 0.8,
visible: true,
zooms: [2, 22],
})
let scatterLayer3 = new Loca.ScatterLayer({
zIndex: 10,
opacity: 0.8,
visible: true,
zooms: [2, 22],
})
let centerPoint = new Loca.GeoJSONSource({
data: {
'type': 'FeatureCollection',
'features': [
{
'type': 'Feature',
'geometry': {
'type': 'Point',
'coordinates': TARGET_POINT,
},
},
],
},
})
scatterLayer3.setSource(centerPoint)
scatterLayer3.setStyle({
size: [300000, 300000],
unit: 'meter',
texture: 'https://a.amap.com/Loca/static/static/center-point.png',
})
this.loca.add(scatterLayer3)
let lineGeoMap
let scatterGeoMap
let setLabelsLayer = (data) => {
labelLayer.clear()
data.features.forEach((item) => {
let labelsMarker = new AMap.LabelMarker({
name: item.properties.province,
position: item.geometry.coordinates,
zooms: [2, 22],
opacity: 1,
zIndex: 10,
text: {
content: item.properties.province,
direction: 'bottom',
offset: [0, -5],
style: {
fontSize: 13,
fontWeight: 'normal',
fillColor: '#fff',
},
},
})
labelLayer.add(labelsMarker)
})
labelLayer.add(
new AMap.LabelMarker({
name: '台湾',
position: TARGET_POINT,
zooms: [2, 22],
opacity: 1,
zIndex: 10,
rank: 100,
text: {
content: '台湾',
direction: 'bottom',
offset: [0, -5],
style: {
fontSize: 13,
fontWeight: 'normal',
fillColor: '#fff',
},
},
}),
)
}
const geoDataPoints = new Loca.GeoJSONSource({
data: this.dataPoints,
});
const geoDataLines = new Loca.GeoJSONSource({
data: this.dataLines,
});
const geoDataLinesReverse = new Loca.GeoJSONSource({
data: this.dataLinesReverse,
});
let loadLocation = () => {
setLabelsLayer(this.dataPoints)
scatterLayer2.setSource(geoDataPoints)
scatterLayer2.setStyle({
size: [250000, 250000],
unit: 'miter',
animate: true,
duration: 1000,
texture: 'https://a.amap.com/Loca/static/static/orange.png',
// texture: 'https://a.amap.com/Loca/static/static/green.png',
})
this.loca.add(scatterLayer2)
// this.loca.animate.start() // 开始动画
}
loadLocation()
let linkLayer = new Loca.LinkLayer({
zIndex: 20,
opacity: 1,
visible: true,
zooms: [2, 22],
})
let loadLine = () => {
linkLayer.setSource(geoDataLines)
linkLayer.setStyle({
lineColors: ['#ff7514', '#ff0008'],
height: (index, item) => {
return item.distance / 2
},
smoothSteps: 300
})
this.loca.add(linkLayer)
}
// loadLine()
// pulse layer
let pulseLayer = new Loca.PulseLinkLayer({
zIndex: 20,
opacity: 1,
visible: true,
zooms: [2, 22],
})
let loadPulse = () => {
pulseLayer.setSource(geoDataLinesReverse)
pulseLayer.setStyle({
height: (index, item) => {
return item.distance / 2
},
unit: 'meter',
dash: [40000, 0, 40000, 0],
lineWidth: function () {
return [20000, 2000]; // 始末 节点的线段宽度
},
// altitude: 1000,
smoothSteps: 100, // 曲线圆滑度
speed: function (index, prop) {
return 1000 + Math.random() * 200000;
},
flowLength: 100000,
lineColors: function (index, feat) {
return ['rgb(255,221,0)', 'rgb(255,141,27)', 'rgb(65,0,255)'];
},
maxHeightScale: 0.3, // 弧顶位置比例
headColor: 'rgba(255, 255, 0, 1)',
trailColor: 'rgb(255,84,84)',
})
this.loca.add(pulseLayer)
}
loadPulse()
this.animateStart()
this.map.on('complete', ()=> {
this.loca.animate.start()
})
}).catch(e => {
console.log(e)
})
},
computed: {
...mapState(['insets']),
// 根据省份地址,生成展示地图需要的格式化数据
dataPoints(){
let tempData = GEO_PROVINCE_DATA.map(item => {
let co = item.center.split(',').map(item => Number(item))
return {
"type": "Feature",
"properties": {"province": item.name},
"geometry": {
"type": "Point", // 点位
"coordinates": co
}
}
})
return {
"type": "FeatureCollection",
"features": tempData
}
},
dataLines(){
let tempData = GEO_PROVINCE_DATA.map(item => {
let co = item.center.split(',').map(item => Number(item))
return {
"type": "Feature",
"properties": {"province": item.name},
"geometry": {
"type": "LineString", // 线段
"coordinates": [
TARGET_POINT, // target location
co
]
}
}
})
return {
"type": "FeatureCollection",
"features": tempData
}
},
dataLinesReverse(){
let tempData = GEO_PROVINCE_DATA.map(item => {
let co = item.center.split(',').map(item => Number(item))
return {
"type": "Feature",
"properties": {"province": item.name},
"geometry": {
"type": "LineString", // 线段
"coordinates": [
co,
TARGET_POINT // target location
]
}
}
})
return {
"type": "FeatureCollection",
"features": tempData
}
},
},
methods: {
animateStart(){
this.loca.viewControl.addAnimates([{
center: {
value: DESTINATION_POINT, // 动画终点的经纬度
control: [TARGET_POINT, DESTINATION_POINT], // 过渡中的轨迹控制点,地图上的经纬度
timing: [0.42, 0, 0.4, 1], // 动画时间控制点
duration: 5000, // 过渡时间,毫秒(ms)
},
// 俯仰角动画
pitch: {
value: 60, // 动画终点的俯仰角度
control: [[0, 0], [1, 60]], // 控制器,x是0~1的起始区间,y是pitch值
timing: [0, 0, 1, 1], // 这个值是线性过渡
duration: 5000,
},
// 缩放等级动画
zoom: {
value: 5, // 动画终点的地图缩放等级
control: [[0, 8], [1, 5]], // 控制器,x是0~1的起始区间,y是zoom值
timing: [0, 0, 1, 1],
duration: 8000,
},
// 旋转动画
rotation: {
value: -30, // 动画终点的地图旋转角度
control: [[0, 0], [1, -30]], // 控制器,x是0~1的起始区间,y是rotation值
timing: [0, 0, 1, 1],
duration: 8000,
}
}],
() => {})
},
resizeMap() {
let mapContainer = document.getElementById('container')
mapContainer.style.height = window.innerHeight + "px"
mapContainer.style.width = window.innerWidth + "px"
},
},
beforeUnmount() {
this.loca.destroy() // 需要先销毁 Loca 再销毁 Map
this.map.destroy() // 销毁地图,释放内存
this.map = null
}
}
</script>
<style lang="scss" scoped>
.map-container {
position: relative;
}
</style>
