1. 图例是图表中对内容区元素的注释、用不同形状、颜色、文字等来标示不同数据列, 通过点击对应数据列的标记, 可以显示或隐藏该数据列。图例虽然不是图表中的主要信息、却是了解图表信息的钥匙。
2. 图例布局
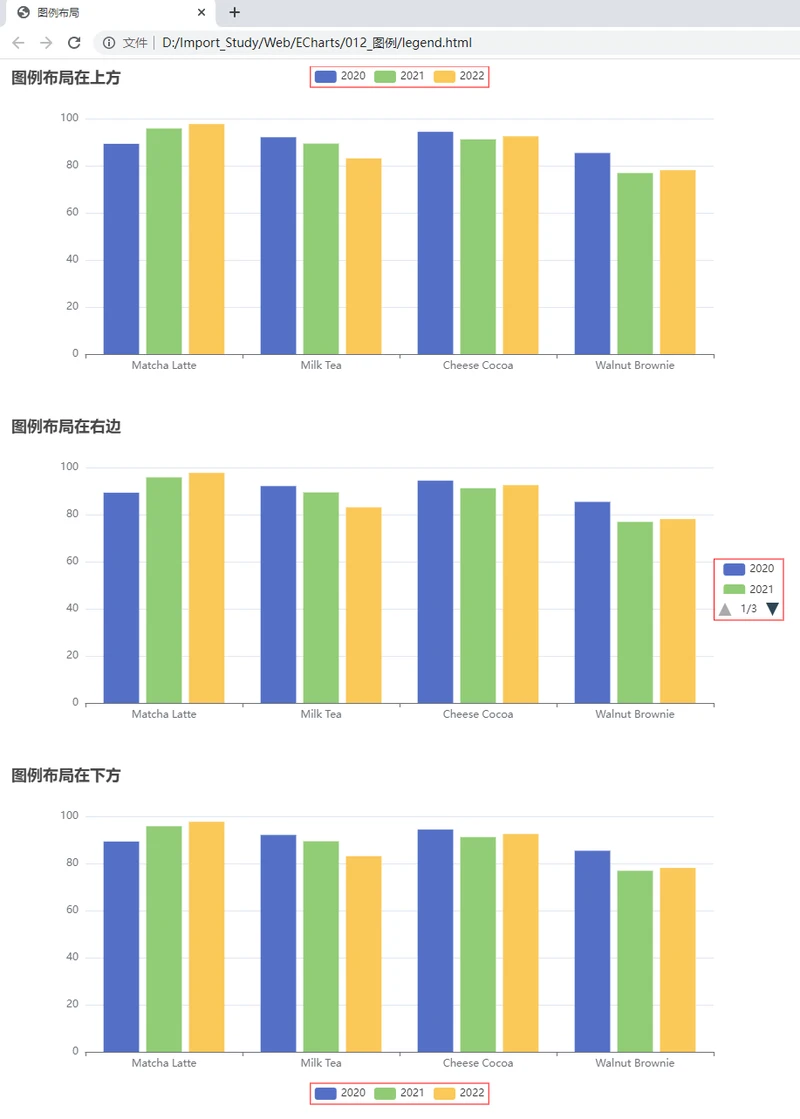
2.1. 图例一般放在图表的右上角、也可以放在图表的底部、同一页面中的所有图例位置保持一致, 可以横排对齐也可以纵排对齐。还要综合考虑整体的图表空间是适合哪种摆放方式。
2.2. legend.type, 图例的类型。可选值: 'plain'普通图例, 缺省就是普通图例; 'scroll'可滚动翻页的图例, 当图例数量较多时可以使用。string类型。
2.3. legend.id , 组件ID。默认不指定。指定则可用于在option或者API中引用组件。string类型。
2.4. legend.show = true, 是否显示图例。boolean类型。
2.5. legend.left = 'auto', 图例组件离容器左侧的距离。left的值可以是像20这样的具体像素值, 可以是像'20%'这样相对于容器高宽的百分比, 也可以是'left', 'center', 'right'。string和number类型。
2.6. legend.top = 'auto', 图例组件离容器上侧的距离。top的值可以是像20这样的具体像素值, 可以是像'20%'这样相对于容器高宽的百分比, 也可以是'top', 'middle', 'bottom'。string和number类型。
2.7. legend.right = 'auto', 图例组件离容器右侧的距离。right的值可以是像20这样的具体像素值, 可以是像'20%'这样相对于容器高宽的百分比。默认自适应。string和number类型。
2.8. legend.bottom = 'auto', 图例组件离容器下侧的距离。bottom的值可以是像20这样的具体像素值, 可以是像'20%'这样相对于容器高宽的百分比。默认自适应。string和number类型。
2.9. legend.width = 'auto', 图例组件的宽度。默认自适应。string和number类型。
2.10. legend.height = 'auto', 图例组件的高度。默认自适应。string和number类型。
2.11. legend.orient = 'horizontal', 例列表的布局朝向。可选: 'horizontal'和'vertical'。string类型。
2.12. legend.borderColor = '#ccc', 图例的边框颜色。Color类型。
2.13. legend.borderWidth = 1, 图例的边框线宽。number类型。
2.14. legend.borderRadius, 圆角半径, 单位px, 支持传入数组分别指定4个圆角半径。number或Array类型。如:
borderRadius: 5, // 统一设置四个角的圆角大小
borderRadius: [5, 5, 0, 0] // (顺时针左上, 右上, 右下, 左下)
2.15. 代码
<!DOCTYPE html>
<html>
	<head>
		<meta charset="utf-8" />
		<title>图例布局</title>
		<!-- 引入echarts.js -->
		<script type="text/javascript" src="echarts.js"></script>
	</head>
	<body>
		<!-- 为ECharts准备一个具备大小(宽高)的DOM -->
		<div id="top" style="width: 900px; height: 400px;"></div>
		<div id="right" style="width: 900px; height: 400px;"></div>
		<div id="bottom" style="width: 900px; height: 400px;"></div>
		<script type="text/javascript">
	    	// 基于准备好的dom, 初始化echarts实例
	      	var mytopChart = echarts.init(document.getElementById('top'));
	      	var myrightChart = echarts.init(document.getElementById('right'));
	      	var mybottomChart = echarts.init(document.getElementById('bottom'));

	      	// 指定图表的配置项和数据
	      	var option = {
	      		// 为图表配置标题
		        title: {
		          text: '图例布局'
		        },
		        // 配置提示信息
		        tooltip: {},
		        // 配置要在X轴显示的项
		        xAxis: {
    			  type: "category" // 类目
  				},
		        // 配置要在Y轴显示的项
		        yAxis: {},
		        // 数据集
		        dataset: {
		          source: [ // 原数据。
		            ['product', '2020', '2021', '2022'],
		        	['Matcha Latte', 89.3, 95.8, 97.7],
		        	['Milk Tea', 92.1, 89.4, 83.1],
		        	['Cheese Cocoa', 94.4, 91.2, 92.5],
		        	['Walnut Brownie', 85.4, 76.9, 78.1]
		          ]
		        },
		        // 系列列表
		        series: [ { type: 'bar' }, { type: 'bar' }, { type: 'bar' } ]
	      	};
	      	// 图例组件
		    var topLegend = {
	          	id: 'top',
	          	show: true,
	          	width: 300, // 宽高设置过大, 也还是包裹内容的大小
	          	height: 80,
	          	borderColor: 'red',
	          	borderWidth: 1,
	          	left: 'center',
	          	top: 'top',
	          	orient: 'horizontal'
	        };
	        option.legend = topLegend;
	        option.title.text = '图例布局在上方';
	      	// 使用刚指定的配置项和数据显示图表。
	      	mytopChart.setOption(option);


	      	// 图例组件
		    var rightLegend = {
	          	id: 'right',
	          	show: true,
	          	width: 80, // 宽高设置过大, 也还是包裹内容的大小
	          	height: 60,
	          	borderColor: 'red',
	          	borderWidth: 1,
	          	type: 'scroll',
	          	right: 10,
	          	top: 'middle',
	          	orient: 'vertical'
	        };
	        option.legend = rightLegend;
	        option.title.text = '图例布局在右边';
	        myrightChart.setOption(option);

	        // 图例组件
		    var bottomLegend = {
	          	id: 'bottom',
	          	show: true,
	          	width: 300, // 宽高设置过大, 也还是包裹内容的大小
	          	height: 80,
	          	borderColor: 'red',
	          	borderWidth: 1,
	          	left: 'center',
	          	bottom: 10,
	          	orient: 'horizontal'
	        };
	        option.legend = bottomLegend;
	        option.title.text = '图例布局在下方';
	        mybottomChart.setOption(option);
	    </script>
	</body>
</html>
2.16. 效果图

3. 图例样式
3.1. legend.formatter, 用来格式化图例文本, 支持字符串模板和回调函数两种形式。string或Function类型。示例:
// 使用字符串模板, 模板变量为图例名称{name}
formatter: 'Legend {name}'
// 使用回调函数
formatter: function (name) {
    return 'Legend ' + name;
}
3.2. legend.icon, 图例项的icon。string类型。ECharts提供的标记类型包括: 'circle', 'rect', 'roundRect', 'triangle', 'diamond', 'pin', 'arrow', 'none'。可以通过'image://url'设置为图片, 其中URL为图片的链接, 或者dataURI。例如:
// URL为图片链接
'image://http://xxx.xxx.xxx/a/b.png'
// URL为dataURI
'image://data:image/gif;base64,R0lGODlhEAAQAMQAAORHHOVSKudfOulrSOp3WOyDZu6QdvCchPGolfO0o/XBs/fNwfjZ0frl3/zy7wAAAAAAAAAAAAAAAAAAAAAAAAAAAAAAAAAAAAAAAAAAAAAAAAAAAAAAAAAAAAAAACH5BAkAABAALAAAAAAQABAAAAVVICSOZGlCQAosJ6mu7fiyZeKqNKToQGDsM8hBADgUXoGAiqhSvp5QAnQKGIgUhwFUYLCVDFCrKUE1lBavAViFIDlTImbKC5Gm2hB0SlBCBMQiB0UjIQA7'
3.3. legend.backgroundColor = 'transparent', 图例背景色, 默认透明。颜色可以使用RGB表示, 比如: 'rgb(128, 128, 128)', 如果想要加上alpha通道, 可以使用RGBA, 比如: 'rgba(128, 128, 128, 0.5)', 也可以使用十六进制格式, 比如: '#ccc'。Color类型。
3.4. legend.data, 图例的数据数组。数组项通常为一个字符串, 每一项代表一个系列的name。图例组件会自动根据对应系列的图形标记(symbol)来绘制自己的颜色和标记, 特殊字符串''(空字符串)或者'\n'(换行字符串)用于图例的换行。如果data没有被指定, 会自动从当前系列中获取。如果要设置单独一项的样式, 也可以把该项写成配置项对象。此时必须使用name属性对应表示系列的name。所有属性: { name , icon , itemStyle , lineStyle , symbolRotate , textStyle }。示例:
data: [{
    name: '系列1',
    // 强制设置图形为圆。
    icon: 'circle',
    // 设置文本为红色
    textStyle: {
        color: 'red'
    }
}]
3.5. legend.textStyle.color = #333, 文字的颜色。Color类型。
3.6. legend.textStyle.fontStyle = 'normal', 文字字体的风格。可选: 'normal'、'italic'和'oblique'。string类型。
3.7. legend.textStyle.fontWeight = 'normal', 文字字体的粗细。可选: 'normal'、'bold'、'bolder'、'lighter'和100 | 200 | 300 | 400...。string和number类型。
3.8. legend.textStyle.fontFamily = 'sans-serif', 文字的字体系列。还可以是'serif', 'monospace', 'Arial', 'Courier New', 'Microsoft YaHei', ...。string类型。
3.9. legend.textStyle.fontSize = 12, 文字的字体大小。number类型。
3.10. legend.textStyle.lineHeight, 行高。number类型。
3.11. legend.textStyle.backgroundColor = 'transparent', 文字块背景色。string和Object类型。可以使用颜色值, 例如:'#123234', 'red', 'rgba(0,23,11,0.3)'。也可以直接使用图片, 当使用图片的时候, 可以使用width或height指定高宽, 也可以不指定自适应。例如:
backgroundColor: {
    image: 'xxx/xxx.png'
    // 这里可以是图片的 URL,
    // 或者图片的 dataURI,
    // 或者 HTMLImageElement 对象,
    // 或者 HTMLCanvasElement 对象。
}
3.12. legend.textStyle.borderColor, 文字块边框颜色。Color类型。
3.13. legend.textStyle.borderWidth, 文字块边框宽度。number类型。
3.14. legend.textStyle.borderType = 'solid', 文字块边框描边类型。string、number和Array类型。可选: 'solid'、'dashed'和'dotted'。自v5.0.0开始, 也可以是number或者number数组, 用以指定线条的dash array, 配合borderDashOffset可实现更灵活的虚线效果。例如:
{
	borderType: [5, 10],

	borderDashOffset: 5
}
3.15. legend.textStyle.borderDashOffset, 用于设置虚线的偏移量, 可搭配borderType指定dash array实现灵活的虚线效果。number类型。
3.16. legend.textStyle.borderRadius, 文字块的圆角。number和Array类型。
3.17. legend.textStyle.padding, 文字块的内边距。number和Array类型。
- padding: [3, 4, 5, 6], 表示[上, 右, 下, 左]的边距。
- padding: 4, 表示padding: [4, 4, 4, 4]。
- padding: [3, 4], 表示padding: [3, 4, 3, 4]。
3.18. legend.textStyle.shadowColor = 'transparent', 文字块的背景阴影颜色。Color类型。
3.19. legend.textStyle.shadowBlur, 文字块的背景阴影长度。number类型。
3.20. legend.textStyle.shadowOffsetX, 文字块的背景阴影X偏移。number类型。
3.21. legend.textStyle.shadowOffsetY, 文字块的背景阴影Y偏移。number类型。
3.22. legend.textStyle.width, 文本显示宽度。number类型。
3.23. legend.textStyle.height, 文本显示高度。number类型。
3.24. legend.textStyle.textBorderColor, 文字本身的描边颜色。Color类型。
3.25. legend.textStyle.textBorderWidth, 文字本身的描边宽度。number类型。
3.26. legend.textStyle.textBorderType = 'solid', 文字本身的描边类型。number、string和Array类型。可选: 'solid'、'dashed'和'dotted'。自v5.0.0开始, 也可以是number或者number数组, 用以指定线条的dash array, 配合textBorderDashOffset可实现更灵活的虚线效果。例如:
{
	textBorderType: [5, 10],

	textBorderDashOffset: 5
}
3.27. legend.textStyle.textBorderDashOffset, 用于设置虚线的偏移量, 可搭配textBorderType指定dash array实现灵活的虚线效果。number类型。
3.28. legend.textStyle.textShadowColor = 'transparent', 文字本身的阴影颜色。Color类型。
3.29. legend.textStyle.textShadowBlur, 文字本身的阴影长度。number类型。
3.30. legend.textStyle.textShadowOffsetX, 文字本身的阴影X偏移。number类型。
3.31. legend.textStyle.textShadowOffsetY, 文字本身的阴影Y偏移。number类型。
3.32. legend.textStyle.overflow = 'none', 文字超出宽度是否截断或者换行。配置width时有效。string类型。可选值:
- 'truncate'截断, 并在末尾显示ellipsis配置的文本, 默认为...。
- 'break'换行。
- 'breakAll'换行, 跟'break'不同的是, 在英语等拉丁文中, 'breakAll'还会强制单词内换行。
3.33. legend.textStyle. ellipsis = '...',在overflow配置为'truncate'的时候, 可以通过该属性配置末尾显示的文本。string类型。
3.34. legend.textStyle. rich, 在rich里面, 可以自定义富文本样式。利用富文本样式, 可以在标签中做出非常丰富的效果。Object类型。
3.35. 代码
<!DOCTYPE html>
<html>
	<head>
		<meta charset="utf-8" />
		<title>图例样式</title>
		<!-- 引入echarts.js -->
		<script type="text/javascript" src="echarts.js"></script>
	</head>
	<body>
		<!-- 为ECharts准备一个具备大小(宽高)的DOM -->
		<div id="main" style="width: 900px; height: 400px;"></div>
		<script type="text/javascript">
	    	// 基于准备好的dom, 初始化echarts实例
	      	var myChart = echarts.init(document.getElementById('main'));

	      	// 指定图表的配置项和数据
	      	var option = {
	      		// 为图表配置标题
		        title: {
		          text: '图例样式'
		        },
		        // 配置提示信息
		        tooltip: {},
		        // 图例组件
		        legend: {
		          formatter: function (name) {
    			    return name + '年';
				  },
		          backgroundColor: 'pink',
		          textStyle: {
	              	fontSize: 16,
	              	lineHeight: 32,
	              	backgroundColor: 'rgba(4, 4, 4, 1)',
	              	borderColor: '#F00',
	              	borderWidth: 3,
	              	borderType: [5, 10],
	              	borderDashOffset: 5,
	              	borderRadius: 5,
	              	padding: 8
	              },
		          data: [
		            {
		              name: '2020',
		              icon: 'circle',
		              textStyle: {
		              	color: 'rgba(20, 231, 58, 1)',
		              	fontStyle: 'normal',
		              	fontWeight: 'normal',
		              	fontFamily: 'serif'
		              }
		            },
		            {
		              name: '2021',
		              icon: 'rect',
		              textStyle: {
		              	color: 'rgba(20, 217, 231, 1)',
		              	fontStyle: 'italic',
		              	fontWeight: 'bold',
		              	fontFamily: 'monospace'
		              }
		            },
		            {
		              name: '2022',
		              icon: 'triangle',
		              textStyle: {
		              	color: 'rgba(104, 20, 231, 1)',
		              	fontStyle: 'oblique',
		              	fontWeight: 'bolder',
		              	fontFamily: 'Courier New'
		              }
		            }
		          ]
		        },
		        // 配置要在X轴显示的项
		        xAxis: {
    			  type: "category" // 类目
  				},
		        // 配置要在Y轴显示的项
		        yAxis: {},
		        // 数据集
		        dataset: {
		          source: [ // 原数据。
		            ['product', '2020', '2021', '2022'],
		        	['Matcha Latte', 89.3, 95.8, 97.7],
		        	['Milk Tea', 92.1, 89.4, 83.1],
		        	['Cheese Cocoa', 94.4, 91.2, 92.5],
		        	['Walnut Brownie', 85.4, 76.9, 78.1]
		          ]
		        },
		        // 系列列表
		        series: [ { type: 'bar' }, { type: 'bar' }, { type: 'bar' } ]
	      	};

	      	// 使用刚指定的配置项和数据显示图表。
	      	myChart.setOption(option);
	    </script>
	</body>
</html>
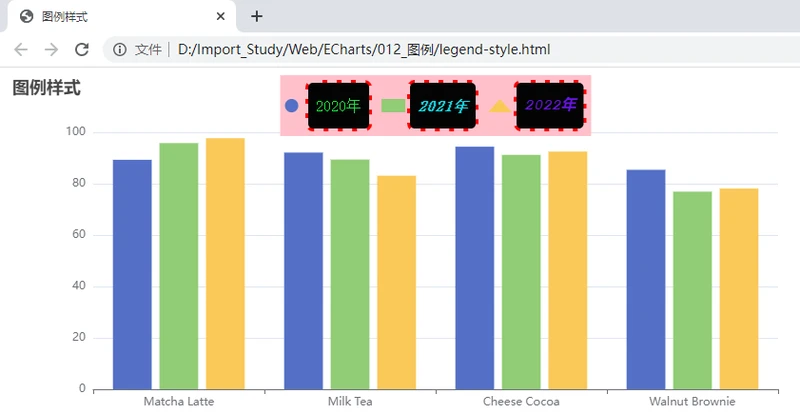
3.36. 效果图

4. 图例交互
4.1. 根据场景需要, 图例可支持交互操作, 点击控制显示或隐藏对应的数据列。
4.2. legend.selected图例选中状态表。Object类型。示例:
selected: {
    // 选中'系列1'
    '系列1': true,
    // 不选中'系列2'
    '系列2': false
}
4.3. 代码
<!DOCTYPE html>
<html>
	<head>
		<meta charset="utf-8" />
		<title>图例选中状态表</title>
		<!-- 引入echarts.js -->
		<script type="text/javascript" src="echarts.js"></script>
	</head>
	<body>
		<!-- 为ECharts准备一个具备大小(宽高)的DOM -->
		<div id="main" style="width: 900px; height: 400px;"></div>
		<script type="text/javascript">
	    	// 基于准备好的dom, 初始化echarts实例
	      	var myChart = echarts.init(document.getElementById('main'));

	      	// 指定图表的配置项和数据
	      	var option = {
	      		// 为图表配置标题
		        title: {
		          text: '图例选中状态表'
		        },
		        // 配置提示信息
		        tooltip: {},
		        // 图例组件
		        legend: {
		          selected: {
		          	'2020': true,
		          	'2021': true,
		          	'2022': false,
		          }
		        },
		        // 配置要在X轴显示的项
		        xAxis: {
    			  type: "category" // 类目
  				},
		        // 配置要在Y轴显示的项
		        yAxis: {},
		        // 数据集
		        dataset: {
		          source: [ // 原数据。
		            ['product', '2020', '2021', '2022'],
		        	['Matcha Latte', 89.3, 95.8, 97.7],
		        	['Milk Tea', 92.1, 89.4, 83.1],
		        	['Cheese Cocoa', 94.4, 91.2, 92.5],
		        	['Walnut Brownie', 85.4, 76.9, 78.1]
		          ]
		        },
		        // 系列列表
		        series: [ { type: 'bar' }, { type: 'bar' }, { type: 'bar' } ]
	      	};

	      	// 使用刚指定的配置项和数据显示图表。
	      	myChart.setOption(option);
	    </script>
	</body>
</html>
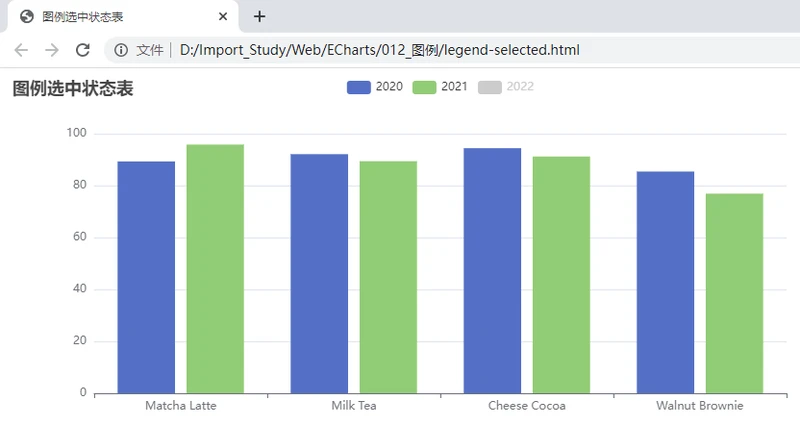
4.4. 效果图

